Kubernetes Grafana数据从Sqlite3迁移到MySQL
- 系统运维
- 2025-07-30
- 479热度
- 0评论
默认Grafana使用Sqlite3作为数据存储,随着数据量的增长,SQLite可能无法满足性能和扩展性的需求。因此,将Grafana的数据库迁移到Mysql。
根据我这里的测试,建议新建环境搭建在进行替换,防止数据不一致出现回滚操作
MySQL数据库配置
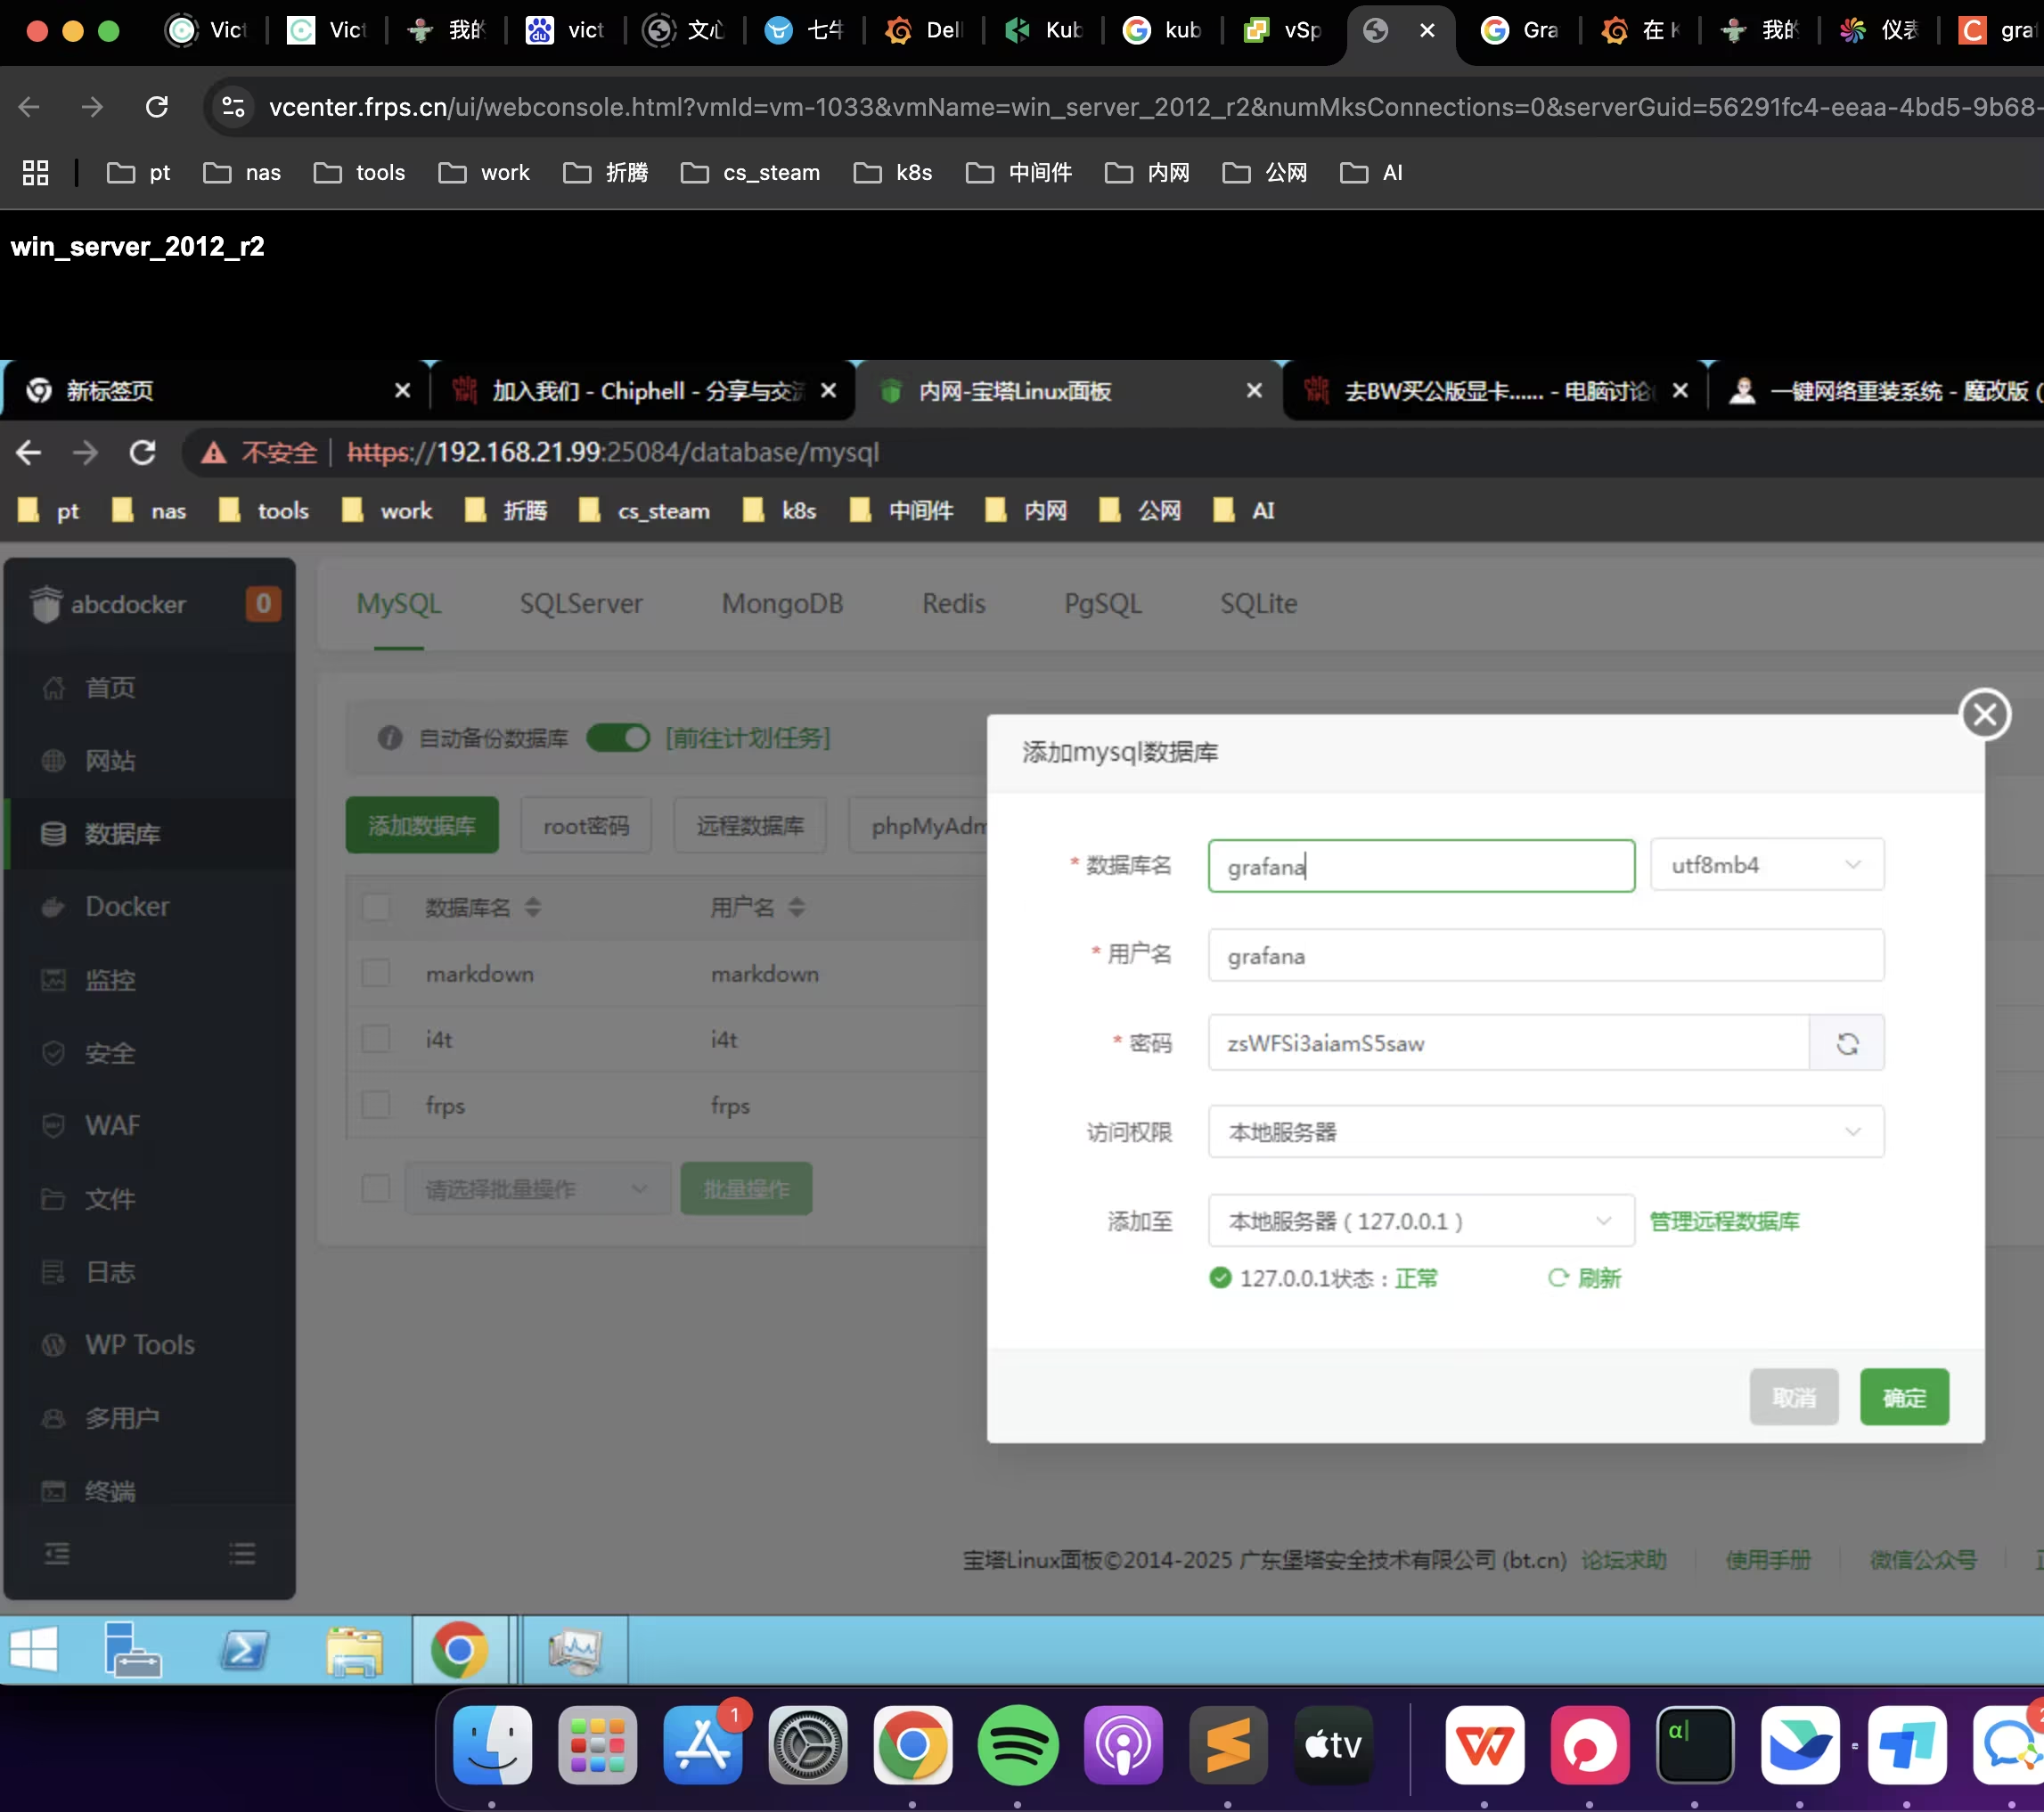
我们想要Grafana使用Mysql数据库,首先需要为Grafana创建数据库,以及用户密码
- 宝塔操作如下
- 命令行如下
#创建数据库
CREATE DATABASE grafana DEFAULT CHARACTER SET utf8 COLLATE utf8_general_ci;

# 添加 puser 数据库用户
create user 'grafana'@'%' identified by 'kTFWFMPTrX65';
grant all privileges on *.* to 'grafana'@'%' identified by "kTFWFMPTrX65";
Grafana 导出数据库
找到我们Grafana容器
root@k8s-master-01:~# kubectl get pod -n tools|grep grafana
grafana-65ff5c99fc-bfnmn            1/1     Running   9 (84m ago)    98m
拷贝DB文件到本地
默认情况下Grafana DB文件在/var/lib/grafana目录中
root@k8s-master-01:~# kubectl cp -n tools grafana-65ff5c99fc-bfnmn:/var/lib/grafana/grafana.db grafana.db安装sqlite工具
root@k8s-master-01:~# apt install sqlite手动将sqlite3 DB文件转换为sql文件
#编写转换脚本
vim sqlite.sh
#!/bin/bash
DB=$1
TABLES=$(sqlite3 $DB .tables | sed -r 's/(\S+)\s+(\S)/\1\n\2/g' | grep -v migration_log)
for t in $TABLES; do
    echo "TRUNCATE TABLE $t;"
done
for t in $TABLES; do
    echo -e ".mode insert $t\nselect * from $t;"
done | sqlite3 $DB

#添加执行权限
chmod +x sqlite.sh
手动进行转换
root@k8s-master-01:~# ./sqlite.sh grafana.db >grafana.sql查看SQL文件
root@k8s-master-01:~# head grafana.sql
TRUNCATE TABLE alert;
TRUNCATE TABLE alert_configuration;
TRUNCATE TABLE ngalert_configuration;
TRUNCATE TABLE alert_configuration_history;
TRUNCATE TABLE org;
TRUNCATE TABLE alert_image;
TRUNCATE TABLE org_user;
TRUNCATE TABLE alert_instance;
TRUNCATE TABLE permission;
TRUNCATE TABLE alert_notification;
Kubernetes 修改Grafana configmap
创建configmap 挂载grafana.ini,新增jdbc配置
#创建grafana.ini  #也可以直接拷贝Grafana.ini,修改
[database]
type = mysql
host = 192.168.21.99:3306
name = grafana
user = grafana
password = "zsWFSi3aiamS5saw"
以Grafana.ini创建configmap
kubectl create configmap grafana-config --from-file=/root/prometheus/grafana/grafana.ini --namespace=tools- --from-file #Grafana配置文件路径
- --namespace #命名空间
- grafana-config #configmap名称
检查configmap
root@k8s-master-01:~# kubectl get cm -n tools|grep grafana
grafana-config             1      2m15s
初始化Grafana
- tools 命名空间
- StorageClass "dsm7-nfs-client" #没有自行创建
创建持久化目录
root@k8s-master-01:~/prometheus/grafana# cat grafana-pvc.yaml
apiVersion: v1
kind: PersistentVolumeClaim
metadata:
  name: grafana-pvc
  namespace: tools
  labels:
    app: grafana
spec:
  storageClassName: "dsm7-nfs-client"
  accessModes:
    - ReadWriteOnce
  resources:
    requests:
      storage: 50Gi
Deployment
root@k8s-master-01:~/prometheus/grafana# cat grafana.yaml
apiVersion: apps/v1
kind: Deployment
metadata:
  name: grafana
  namespace: tools
spec:
  selector:
    matchLabels:
      app: grafana
  template:
    metadata:
      labels:
        app: grafana
    spec:
      volumes:
        - name: storage
          persistentVolumeClaim:
            claimName: grafana-pvc
        - name: grafana-config
          configMap:
            name: grafana-config
      securityContext:
        runAsUser: 0
      containers:
        - name: grafana
          image: dockerproxy.frps.fun/grafana/grafana:12.0.2
          imagePullPolicy: IfNotPresent
          ports:
            - containerPort: 3000
              name: grafana
          env:
            - name: GF_SECURITY_ADMIN_USER
              value: admin
            - name: GF_SECURITY_ADMIN_PASSWORD
              value: admin321
          readinessProbe:
            failureThreshold: 10
            httpGet:
              path: /api/health
              port: 3000
              scheme: HTTP
            periodSeconds: 10
            successThreshold: 1
            timeoutSeconds: 30
          livenessProbe:
            failureThreshold: 3
            httpGet:
              path: /api/health
              port: 3000
              scheme: HTTP
            periodSeconds: 10
            successThreshold: 1
            timeoutSeconds: 1
          resources:
            limits:
              cpu: 150m
              memory: 512Mi
            requests:
              cpu: 150m
              memory: 512Mi
          volumeMounts:
            - mountPath: /var/lib/grafana
              name: storage
            - mountPath: /etc/grafana
              name: grafana-config
Grafana svc配置文件,默认使用nodeport
root@k8s-master-01:~/prometheus/grafana# cat grafana-svc.yaml
apiVersion: v1
kind: Service
metadata:
  name: grafana
  namespace: tools
spec:
  type: NodePort
  ports:
    - port: 3000
  selector:
    app: grafana
创建完毕后,可以检查下Pod状态
root@k8s-master-01:~# kubectl get pod -n tools|grep grafana
grafana-6bd875d986-cnrjj            1/1     Running   0               15m
目前Grafana没有图标
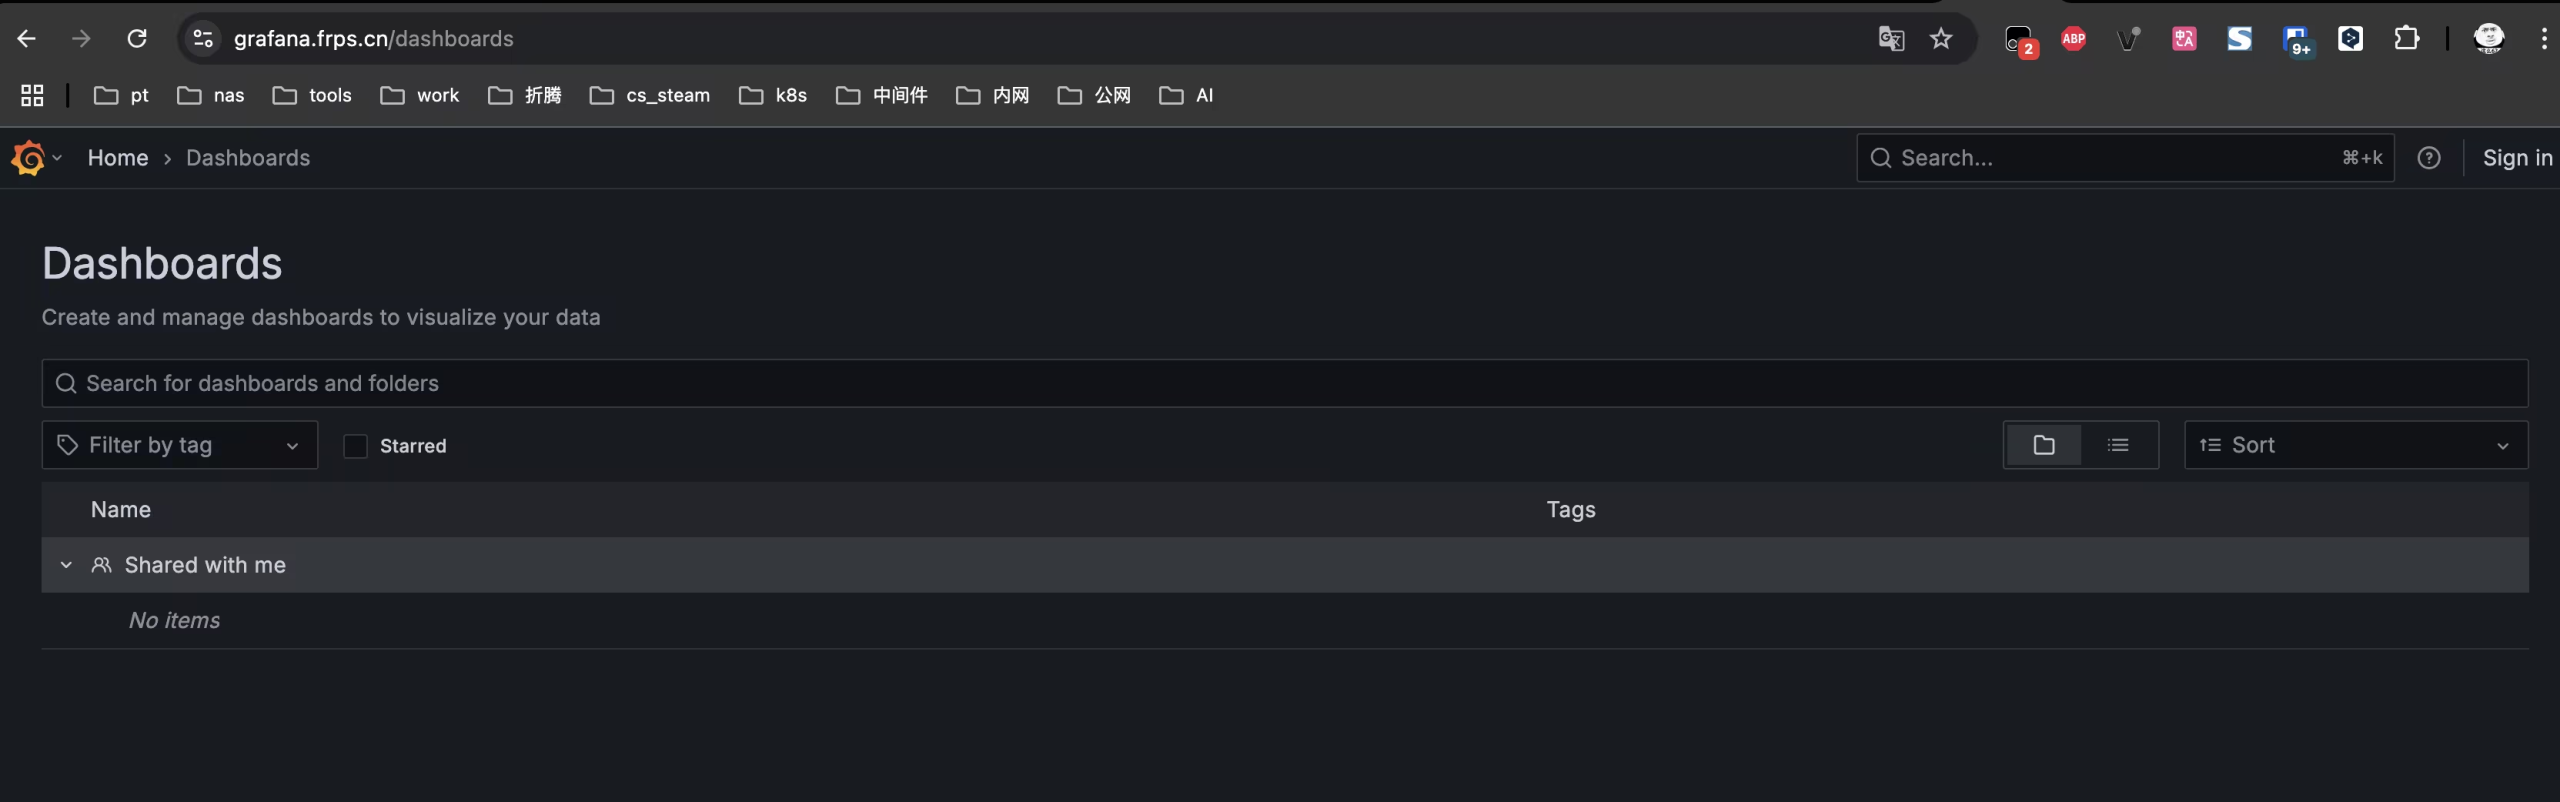
查看数据库表结构
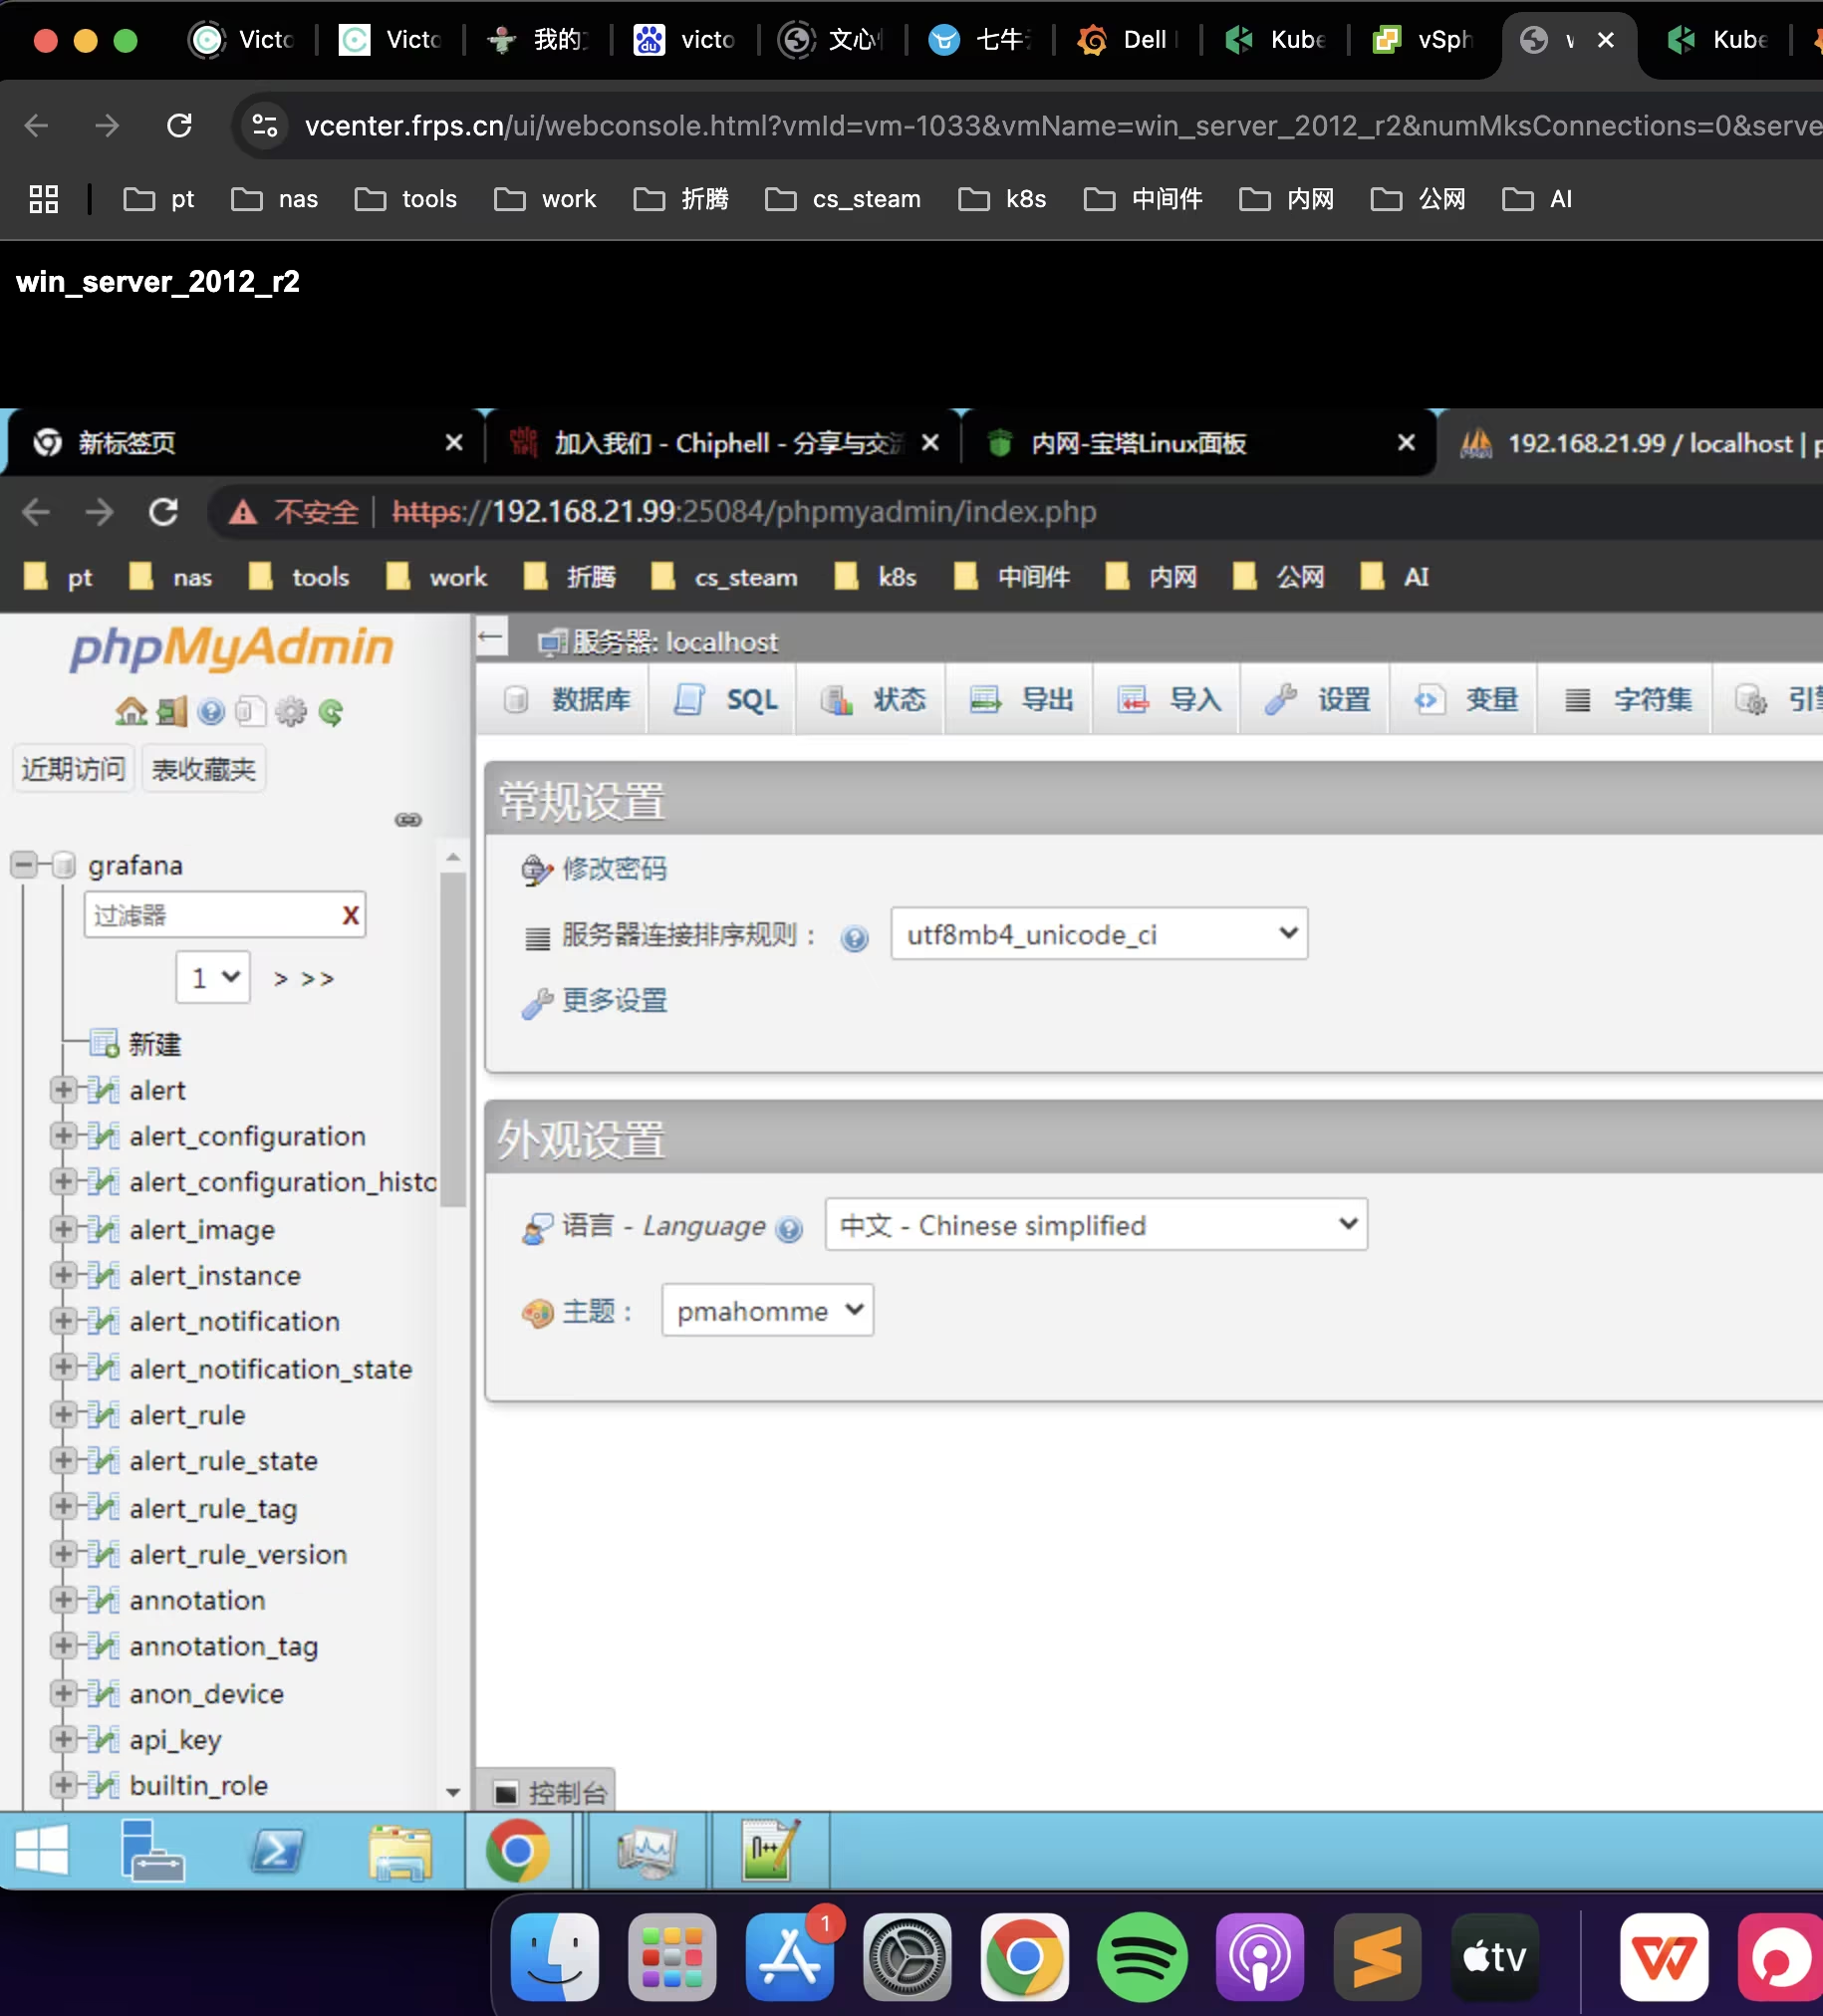
导入备份Grafana DB文件
Grafana初始化会为Mysql创建表结构,有了表结构我们在导入数据极客
[root@ops ~]# cd /tools/
[root@ops tools]# ls
grafana.sql  index.html
[root@ops tools]# mysql -ugrafana -p
Enter password:
Welcome to the MySQL monitor.  Commands end with ; or \g.
Your MySQL connection id is 69068
Server version: 5.7.44-log Source distribution

Copyright (c) 2000, 2023, Oracle and/or its affiliates.

Oracle is a registered trademark of Oracle Corporation and/or its
affiliates. Other names may be trademarks of their respective
owners.

Type 'help;' or '\h' for help. Type '\c' to clear the current input statement.

mysql> use grafana;
Database changed
mysql> source /tools/grafana.sql;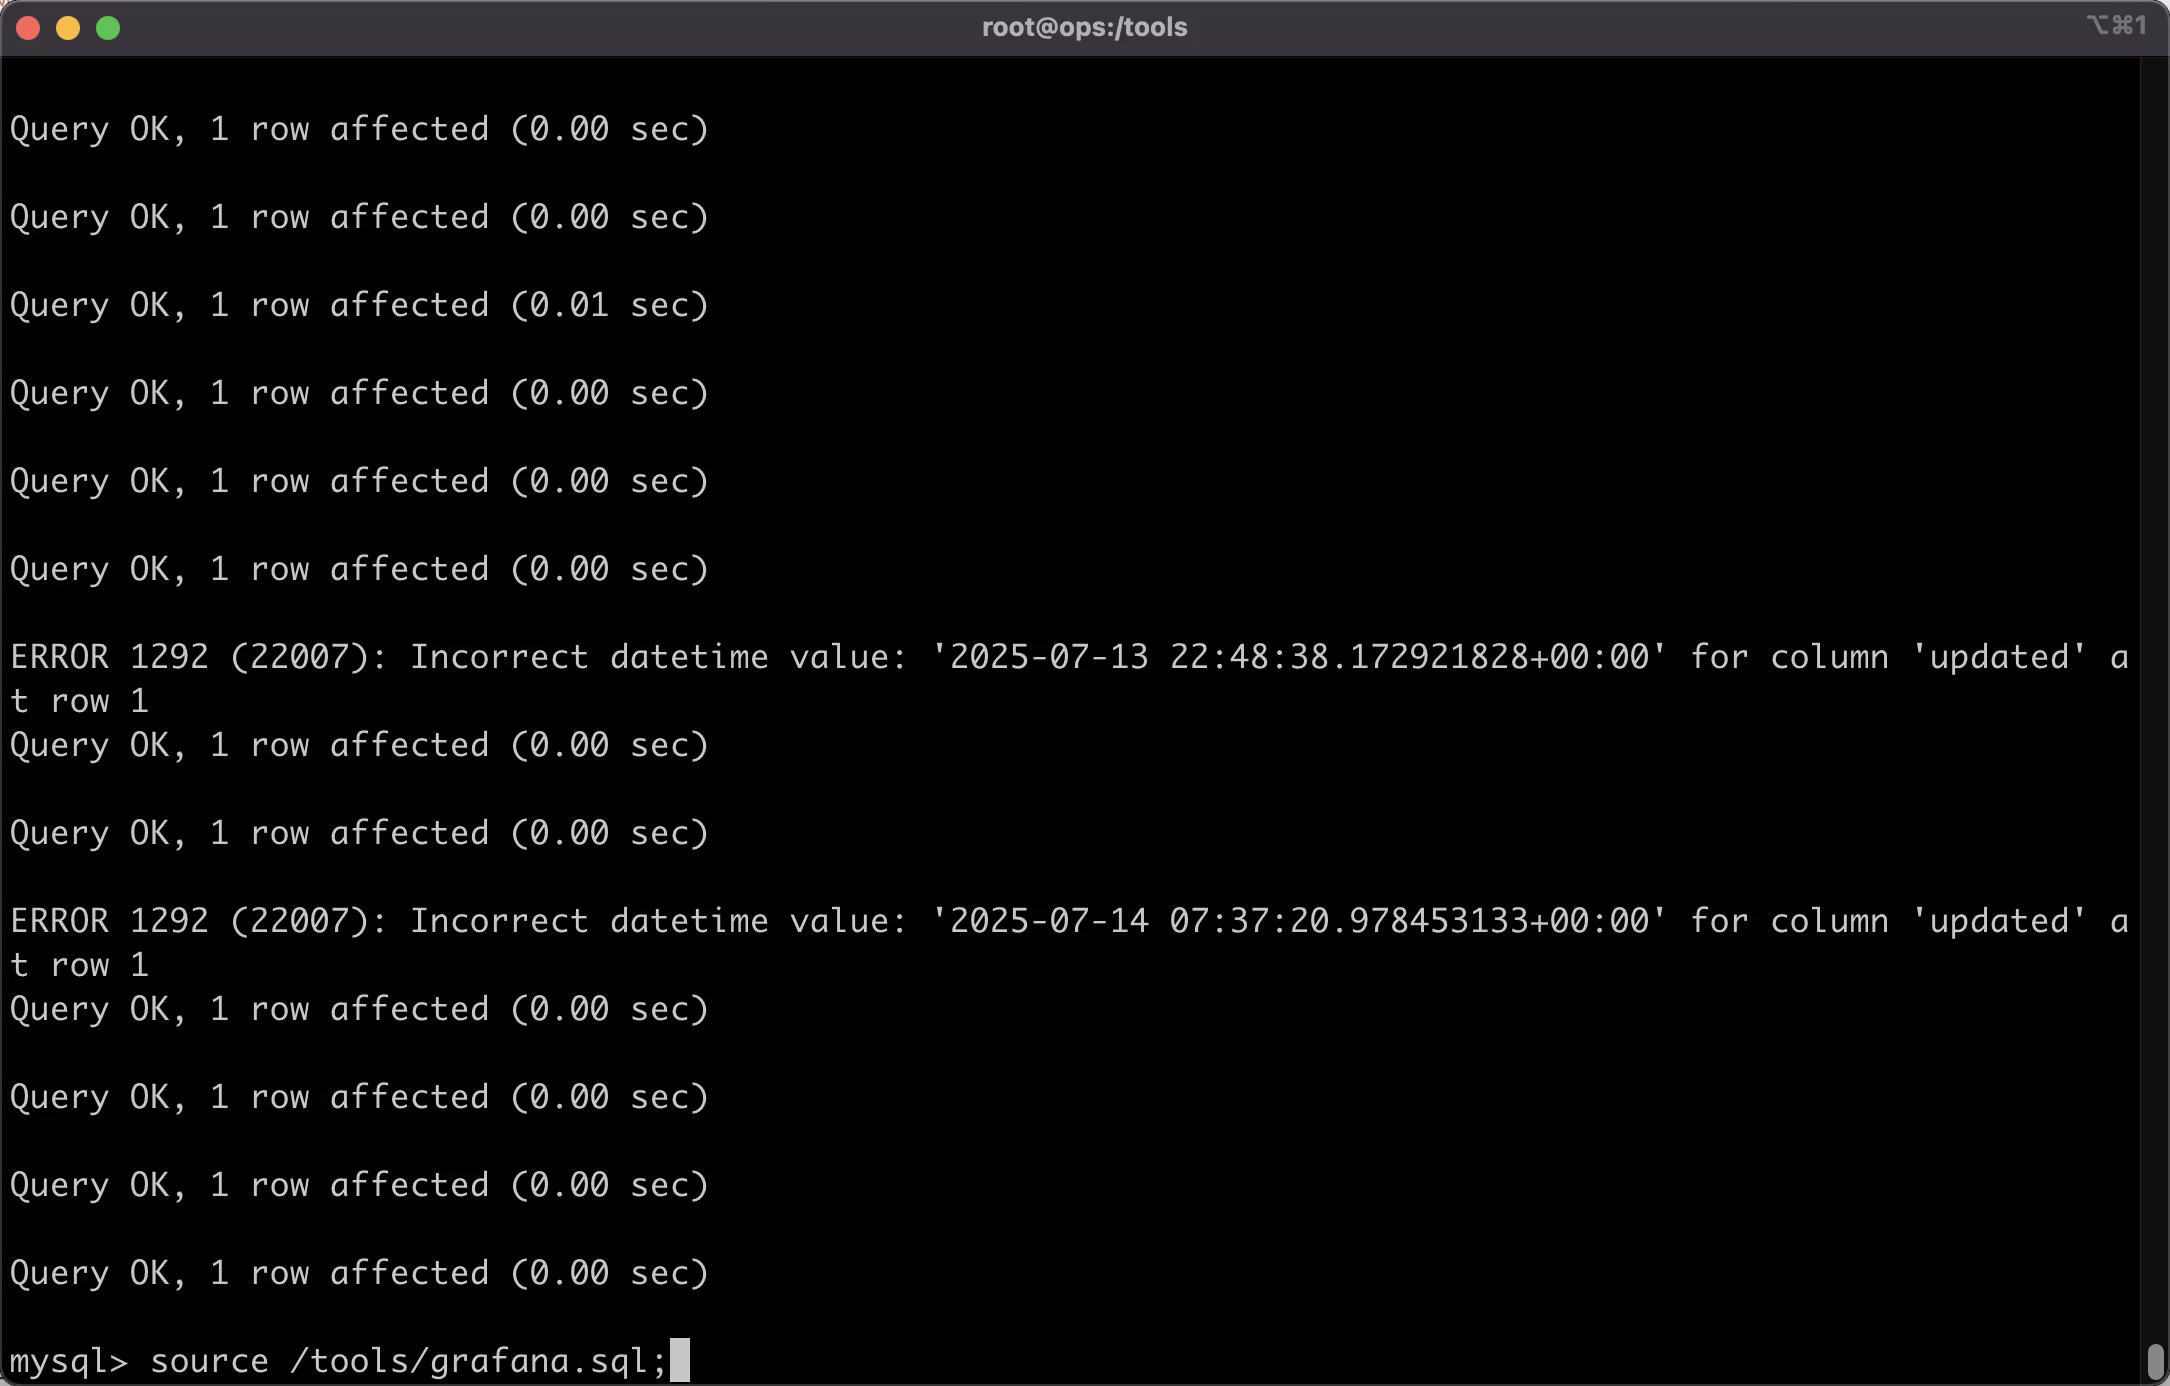
数据导入完毕
接下来重启Grafana
root@k8s-master-01:~# kubectl delete pod -n tools grafana-6bd875d986-cnrjj
pod "grafana-6bd875d986-cnrjj" deleted
启动完毕检查下pod状态
root@k8s-master-01:~/prometheus/grafana# kubectl get pod -n tools|grep grafana
grafana-6bd875d986-2qggt            1/1     Running   0               55s
提示,数据迁移有风险,请提前备份